 AI TL;DR
Too lazy to read? Summarize this post with:
Blog Post Publish Date: 2026/11/18
A Hands-On Example of Decoupling App Instrumentation with OpenTelemetry#
This post builds a small Python service instrumented with OpenTelemetry, one piece at a time. It starts with the API only, turns on the SDK without changing the code, routes the metrics through the OpenTelemetry Collector to Prometheus, and then switches to Datadog by changing only the Collector configuration.
It's the hands-on companion to OpenTelemetry: A Framework for Decoupling Your Observability, which explains what OpenTelemetry is, the vendor lock-in it removes, and what the Collector is for. This post doesn't repeat those concepts, so if they're new to you, start there.
The Example#
The example is a payment service, and we want to know how many payments it processes and how long each one takes. The application code is written once, in step 1, and never changes after that. Each step adds one OpenTelemetry piece around it:
Step |
Piece added |
What it does |
|---|---|---|
1 |
API |
Describes what to measure, inside the code |
2 |
SDK |
Processes the measurements and sends them over OTLP |
3 |
Collector |
Receives OTLP and exports it to Prometheus |
Payoff |
Collector config |
Switches the backend to Datadog |
Step 1: Instrument the Code With the API Only#
app.py holds the business logic and the instrumentation. It imports only the OpenTelemetry API, without the SDK, an exporter, or any vendor library.
import random
import time
from time import perf_counter

# it is the API library
from opentelemetry import metrics


# Get a meter from the OpenTelemetry API.
meter = metrics.get_meter("payment-api")

# Create instruments.
payments_processed = meter.create_counter(
    "payments_processed",
    description="Number of processed payments"
)

payment_duration = meter.create_histogram(
    "payment_processing_duration",
    unit="s",
    description="Payment processing duration",
    # bucket boundaries in seconds; the defaults are sized for milliseconds
    explicit_bucket_boundaries_advisory=[0.1, 0.2, 0.3, 0.4, 0.5, 1.0],
)


def process_payment():
    start = perf_counter()

    # Simulate payment processing.
    time.sleep(random.uniform(0.1, 0.5))

    if random.random() > 0.1:
        status = "success"
    else:
        status = "failure"

    # Record the number of processed payments.
    payments_processed.add(1, {"status": status})

    # Record how long the operation took.
    payment_duration.record(
        perf_counter() - start,
        {"status": status}
    )

    print(f"Payment processed: {status}")


if __name__ == "__main__":
    while True:
        process_payment()
metrics.get_meter() returns a meter, the object that creates instruments. The code creates two of them, a counter for a total that only goes up (processed payments) and a histogram for a distribution of values (processing durations). Each payment records one measurement in each instrument, with a status attribute.
A histogram counts values in buckets, and the explicit_bucket_boundaries_advisory argument sets them. The SDK's default boundaries are 0, 5, 10, 25, 50, 75, 100, …, sized for milliseconds. Our durations are between 0.1 and 0.5 seconds, so with the defaults every payment would land in the first bucket (0 to 5), and percentiles such as p95 would be useless. The advisory boundaries are part of the API, so app.py still doesn't depend on the SDK.
Install the API and run it.
pip install opentelemetry-api
python app.py
The script runs and exports nothing, by design. Without an SDK, every API call is a no-op, so a library author can instrument their code with the API at almost no cost to users who don't use OpenTelemetry. The API describes what to measure, and the SDK decides where the data goes.
Step 2: Turn On the SDK Without Touching the Code#
Now we want the data to leave the process, which is the SDK's job. The simplest way to add it is the opentelemetry-instrument launcher, which loads the SDK before your code runs and configures it from environment variables.
pip install opentelemetry-distro opentelemetry-exporter-otlp

export OTEL_SERVICE_NAME=payment-api
export OTEL_EXPORTER_OTLP_ENDPOINT=http://localhost:4317
export OTEL_TRACES_EXPORTER=none
export OTEL_LOGS_EXPORTER=none
export OTEL_METRICS_EXPORTER=otlp

opentelemetry-instrument python app.py
app.py is the same file as in step 1. The environment variables set the service name (the service.name attribute from the semantic conventions), which backends use to identify the service, and tell the SDK to send metrics over OTLP to localhost:4317. In Python, the otlp exporter defaults to gRPC, whose standard port is 4317. OTLP over HTTP uses port 4318, and it's the default in some other languages.
If the application used Flask or requests, zero-code instrumentation would also cover those libraries without code changes, recording HTTP metrics, plus traces if you turn on a traces exporter. To get it, first run opentelemetry-bootstrap -a install, which installs the instrumentation packages for the libraries it finds in your environment.
If you prefer to configure the SDK in code, put the same setup in its own file, separate from app.py.
from opentelemetry import metrics
from opentelemetry.sdk.metrics import MeterProvider
from opentelemetry.sdk.metrics.export import PeriodicExportingMetricReader
from opentelemetry.sdk.resources import Resource
from opentelemetry.exporter.otlp.proto.grpc.metric_exporter import OTLPMetricExporter

# Who is sending the data (semantic convention: service.name).
resource = Resource.create({"service.name": "payment-api"})

# Where and how to send it: OTLP over gRPC, pushed periodically.
reader = PeriodicExportingMetricReader(
    OTLPMetricExporter(endpoint="http://localhost:4317", insecure=True)
)

# Register the SDK implementation behind the API.
metrics.set_meter_provider(MeterProvider(resource=resource, metric_readers=[reader]))
telemetry.py has to register the SDK before the first measurement, so you need a small entry point that imports it first. app.py still doesn't change:
import telemetry  # registers the SDK before any measurement
from app import process_payment

while True:
    process_payment()
Run it with python main.py. The opentelemetry-instrument approach avoids this extra file, which is one reason I prefer it.
Either way, the application now sends OTLP and doesn't know whether Prometheus, Datadog, or anything else is at the other end. Something has to receive that OTLP, and that's the Collector's job.
Step 3: Route the Data With the Collector#
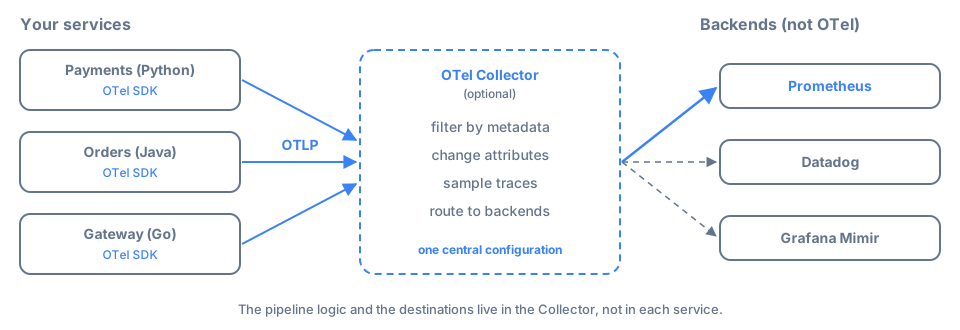
The first post explains what the Collector is for. Here we only need its configuration, which defines a pipeline in three parts. Receivers define how data comes in, here OTLP over gRPC on port 4317. Processors work on the data along the way, here by batching it. Exporters define where it goes, here a Prometheus endpoint on port 8889 and the Collector's console.
receivers:
  otlp:
    protocols:
      grpc:
        endpoint: 0.0.0.0:4317

processors:
  batch: {}

exporters:
  # expose the metrics for Prometheus to scrape
  prometheus:
    endpoint: 0.0.0.0:8889
  # also print a summary to the Collector's console
  debug:
    verbosity: basic

service:
  pipelines:
    metrics:
      receivers: [otlp]
      processors: [batch]
      exporters: [prometheus, debug]
Run the Collector with Docker, using the contrib distribution, which includes both the Prometheus and the Datadog exporters.
docker run --rm \
  -p 4317:4317 -p 8889:8889 \
  -v "$(pwd)/collector.yaml:/etc/otelcol-contrib/config.yaml" \
  otel/opentelemetry-collector-contrib:0.114.0
With the application from step 2 running, the Collector exposes the metrics in the Prometheus format, ready for a Prometheus server to scrape. Trimmed, the output looks like this (your numbers will differ):
$ curl -s http://localhost:8889/metrics | grep payments_processed

payments_processed_total{job="payment-api",status="success"} 412
payments_processed_total{job="payment-api",status="failure"} 47
The counter gets the _total suffix that Prometheus expects for counters, and service.name becomes the job label. Depending on the Collector version, you'll also see extra labels such as instance and otel_scope_name, and a target_info metric with the resource attributes. The histogram appears as payment_processing_duration_seconds_bucket, with one series per bucket boundary from step 1.
The Payoff: Switching Backends#
This is the vendor lock-in scenario from the first post, now in practice. The company decides to send metrics to Datadog, and you change only the exporters in collector.yaml.
exporters:
  datadog:
    api:
      key: ${env:DD_API_KEY}

service:
  pipelines:
    metrics:
      receivers: [otlp]
      processors: [batch]
      exporters: [datadog]
Then restart the Collector, passing the API key as an environment variable.
docker run --rm \
  -p 4317:4317 \
  -e DD_API_KEY=<your-api-key> \
  -v "$(pwd)/collector.yaml:/etc/otelcol-contrib/config.yaml" \
  otel/opentelemetry-collector-contrib:0.114.0
If your Datadog account isn't on the default US site, also set site under api, for example site: datadoghq.eu (Datadog exporter docs).
Neither app.py nor the SDK configuration changed, and the application wasn't redeployed. During a migration, you can also list both exporters and send the same data to Prometheus and Datadog at the same time.
Key Takeaways#
The application code depends only on the OpenTelemetry API. Without an SDK, API calls do nothing, so instrumented code is always safe to run.
A meter creates instruments, like a counter for totals that only go up and a histogram for distributions such as durations.
opentelemetry-instrumentandOTEL_*environment variables turn on and configure the SDK without changing the code. A separatetelemetry.pydoes the same in code.service.nameidentifies the service in the backends. Prometheus shows it as thejoblabel.Set histogram bucket boundaries that match your unit. The defaults are sized for milliseconds.
The Collector pipeline has receivers, processors, and exporters. Switching from Prometheus to Datadog means changing the exporters.
During a migration, the Collector can export the same data to both backends at once.
References#
I'm Carlos Neto, and this blog is where I share my experiences and open source contributions. More about me on my home page. If you have questions or a different approach, contact me on LinkedIn.